

Developer Experience on Wheels - Case study of Gitpod
A deep dive into insightful quality metrics using Dev-data of Gitpod


Hey readers, This is a case study release of Gitpod, an Open Source project that has massively changed the developer experience. Our team of Junior Developer Evangelists (JDEs) in this cohort of the JDE Program (a unique platform for JDEs to advocate the power of Open source through their skills).
"Project Spotlight" is an activity which aims to feature and recognize impactful Open Source projects. JDEs involve in creating case studies, analysing Dev-data using DevLake and creating dashboards for various use cases. The project for the first spotlight is Gitpod.
What is Gitpod?
Gitpod is a faster, more resource-efficient, open-source platform for automated and ready-to-code development environments. It enables developers to describe their dev environment as code and start instant and fresh development environments for each new task directly from the browser. Gitpod reduces the need to install local development environments and deal with incompatible dependencies. Thereby it allows you to start coding or debugging immediately, from any context, at any time.
What is DevLake?
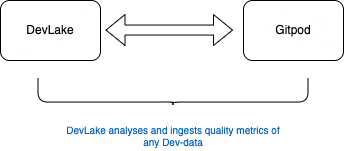
DevLake is an Open-source DORA metric tool, that ingests any Dev-data into meaningful information to analyze, make future decisions and improve. Learn more about how to get started with DevLake. Our team of JDEs discovered some observations and key metrics that can help the Maintainers.
Dashboards
The snapshot below is an example of a general dashboard
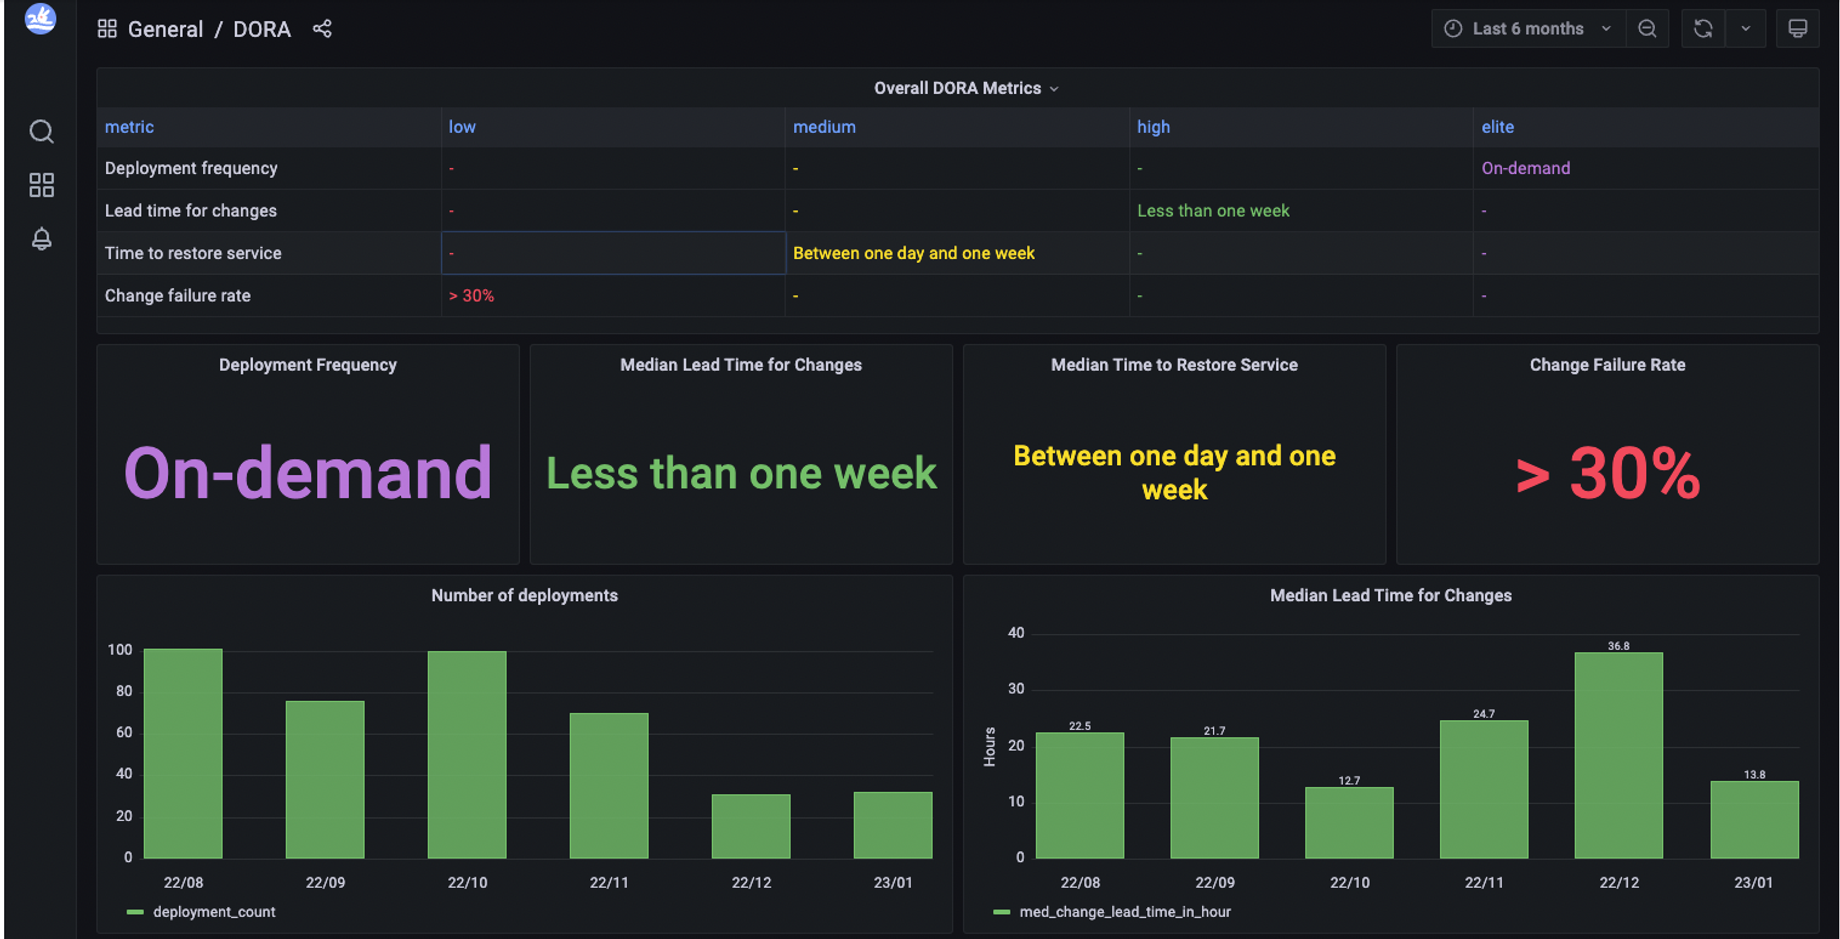
We can see how our DevLake project has fetched some of the information based on different factors and displayed it on a single screen for a better understanding of the happening of a project. To explore more visit: https://devlake.apache.org/livedemo/EngineeringLeads/DORA
The question on your mind right now should be how this all works and which tech stacks are used to create this representation of the dashboards.
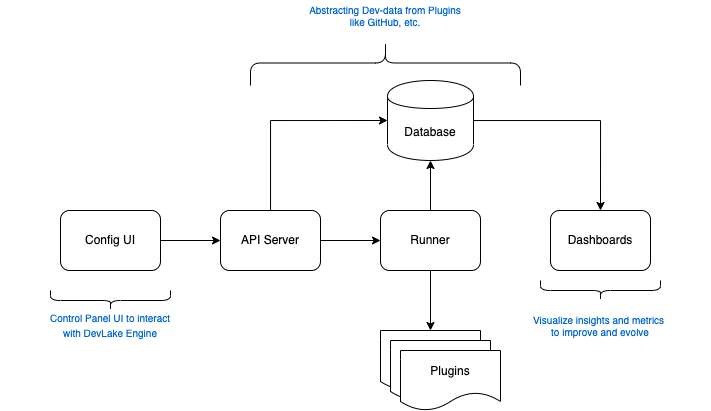
A DevLake architecture typically consists of the following components:
Config UI
API Server
Runner
Database
Plugins
Dashboard
To get a more detailed answer to the above question visit here and have a look at the architecture of DevLake.
Using the above process we created four dashboards for the Gitpod project:
Community Dashboard
Dora Dashboard
Overview Dashboard
All these dashboards are configured using GitHub following the process given in this link. The interesting fact is that DevLake is not only limited to the GitHub configuration but offers various other configurations such as:
GitLab
Jira
Jenkins
BitBucket
A few more are currently in the beta and testing phase.
Community centric Dashboard
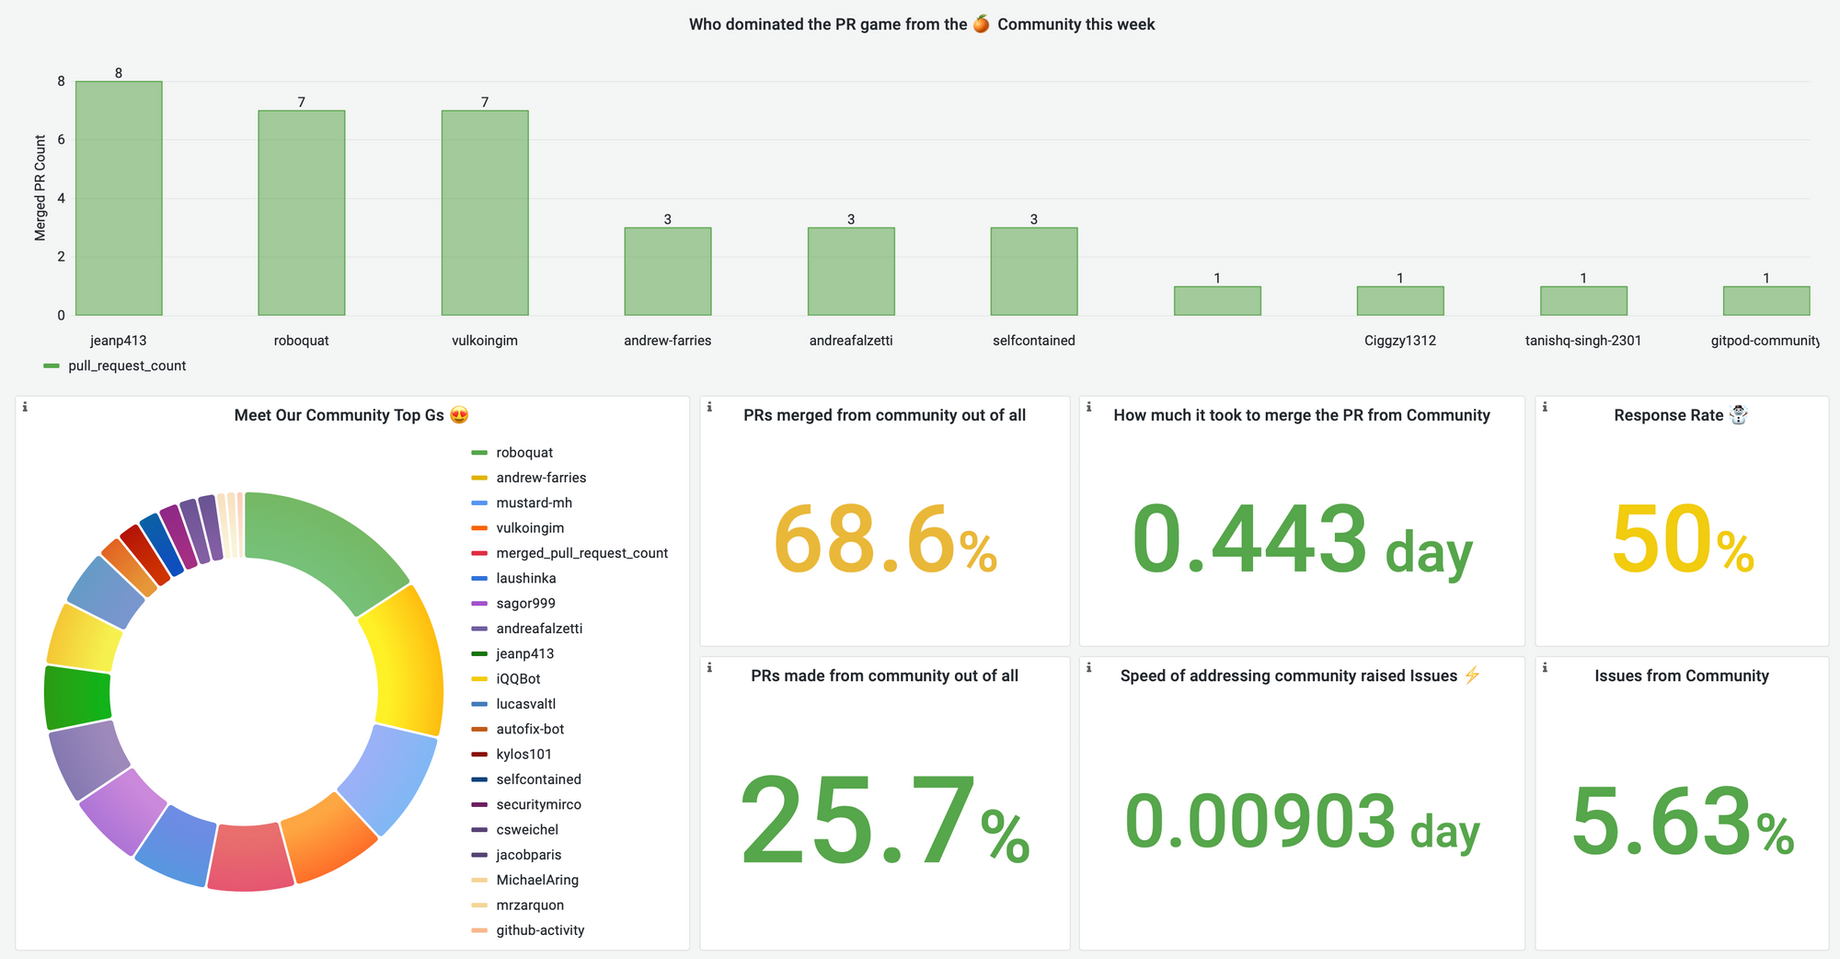
Our team of JDEs built the community dashboard using DevLake, which sheds a perspective on community-centric metrics useful for an Open Source project such as Gitpod.
The purpose
Community metrics are crucial for OSS projects because they support data-driven decision-making, monitor the community's health and growth, help draw new contributors, and retention of existing contributors by giving them recognition.
These indicators encourage community interaction, shed light on the project's current situation, and provide information for upcoming choices.
Key indicators for Gitpod from the above Dashboard
Top contributors (bar graph)
68.8% of PRs merged are a result of community contributions
It took 0.443 days ~ 10 hours to merge PRs made by the Community
How can these Metrics help you grow?
To measure the Frequency of contributions
To discover the scope of improvement in terms of community experience
Opportunity to improve developer documentation and onboarding
Community-centric Metrics for Gitpod
- Community Top Contributors
A metric to highlight the most active community members!
Why this metric?
Increases motivation
Attracts new contributors
Keeps the Community spirit alive
In conclusion, top contributors are essential to the success of open-source projects because they inspire and retain important contributors, draw in new contributors, exhibit transparency and inclusivity, and foster a feeling of community.
Note: Bots need to be removed from the above list ( can be easily done via a very simple SQL query using DevLake )
- PRs merged from the Community
68.8% of total PRs merged are from Community contributions
A metric for tracking the percentage of merged Pull Requests made by the community!
Why this metric?
Organisation perspective: Monitoring merged PRs can help in prioritising development efforts and ensuring that the most significant contributions are immediately merged into the project.
Community perspective: Helps in understanding the types of contributions most valued by the project and guiding their future contributions accordingly, as well as providing a sense of contributions.
- Time is taken to merge PRs made by the Community
It takes 0.443 days ~ 10 hours to merge PRs made by the Gitpod Community
A metric that helps to keep track of the average time it takes to merge a Pull Request made by a community member!
Why this metric?
Helps the contributors to understand the average time it takes to get their PRs merged and ensures that the PRs are being reviewed without any delays.
DORA Dashboard
DORA (DevOps Research and Assessment) is a practice as defined by Google Cloud. It is essentially a framework that enables teams to focus on a performance-driven rather than a power-driven approach to achieve overall success. This ensures teams invest their efforts in Research, Delivery, and Maintainance to achieve better business outcomes. Learn more about DORA.
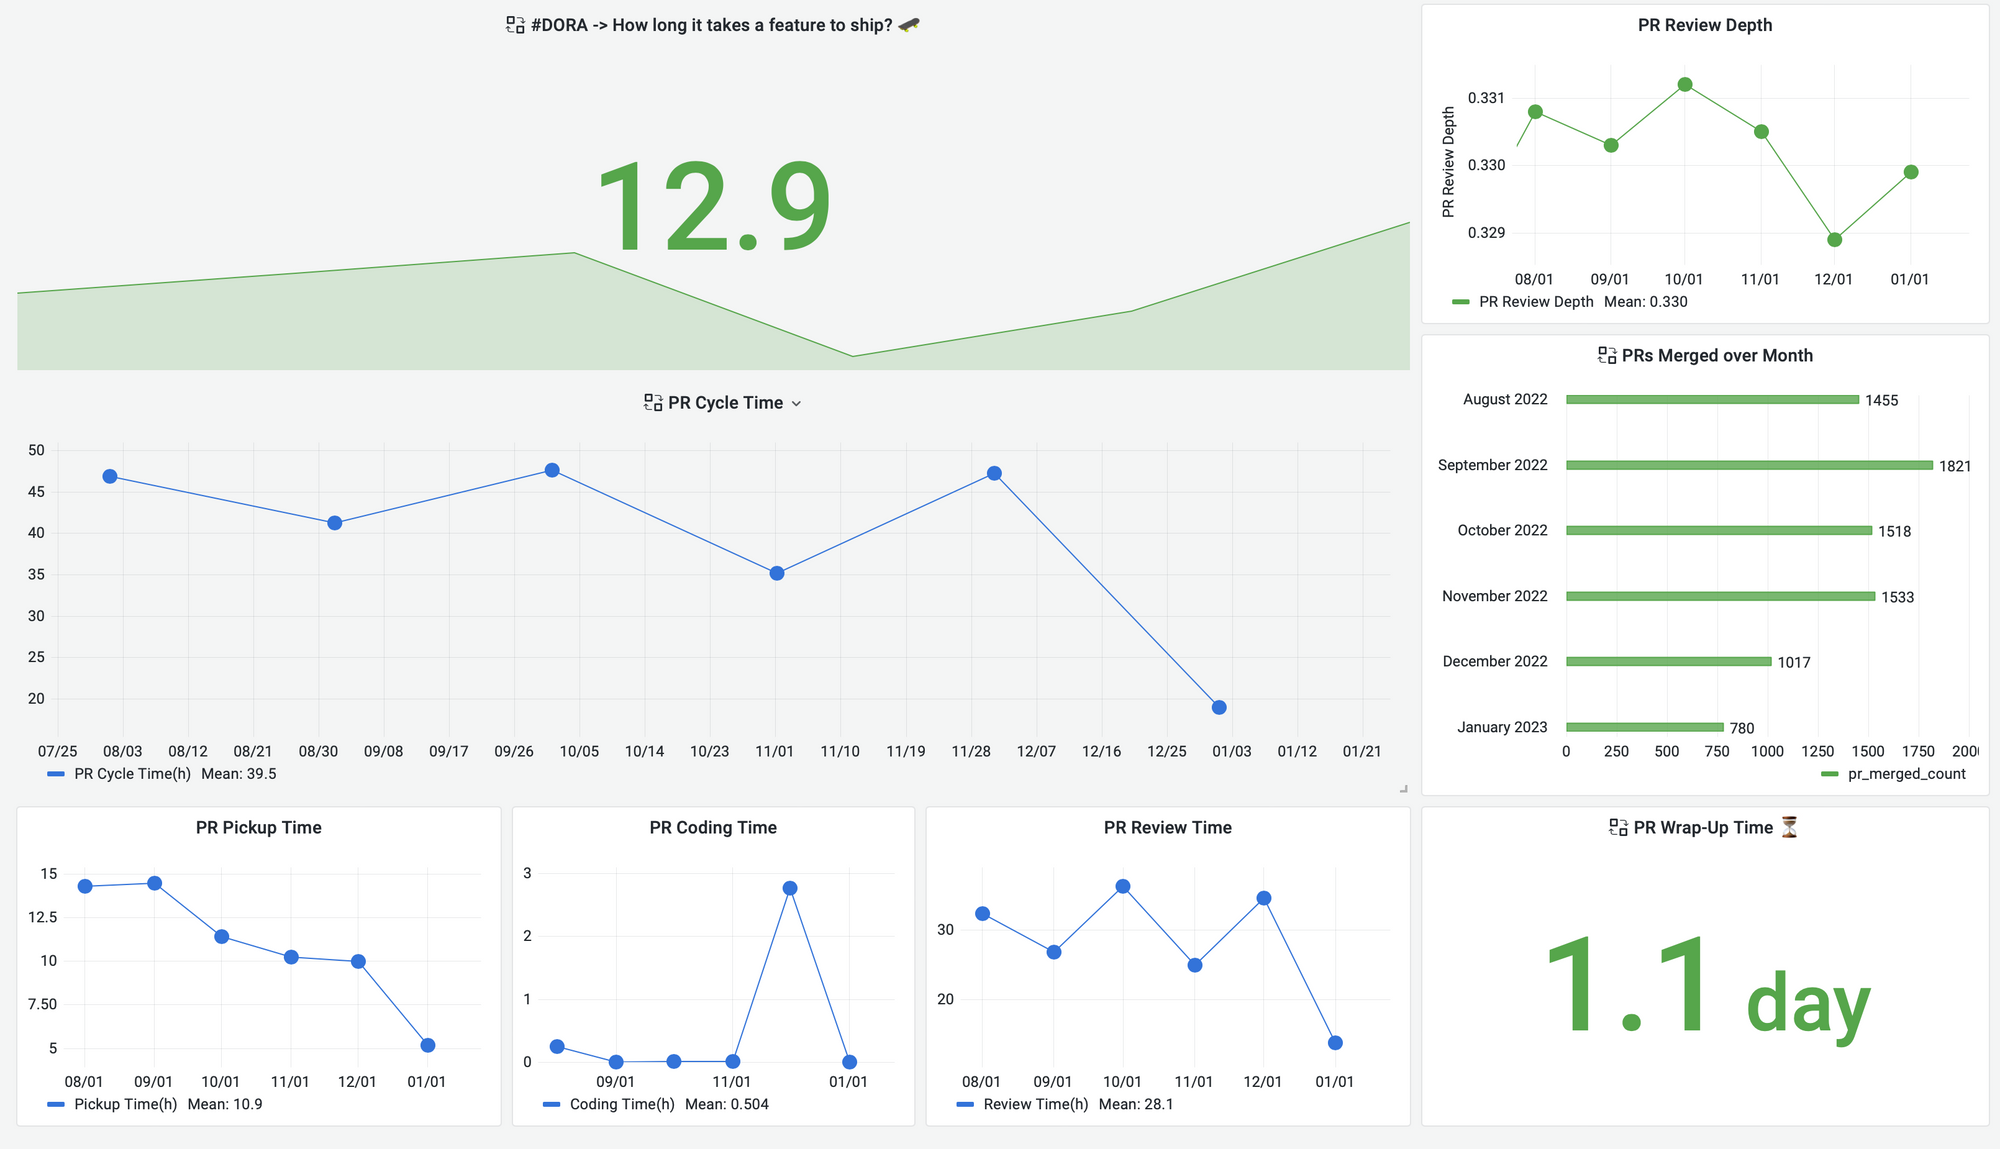
The above DORA dashboard for Gitpod is created using DevLake
DORA Metrics for Gitpod
- Number of PRs merged over a month
1821 PRs were merged into Gitpod's repository in September 2022
This metric by definition enables us to measure the number of successful PRs over a certain period. As seen in the bar graph above, September is the month of the most successful PRs for Gitpod. The reason behind DORA and particularly to measure this is not comparison nor pushing but to ensure teams are set towards goals and the right resources are allocated with standard practices and better decision making. This overall builds a "Continuous Improvement" culture.
- Time is taken to launch a feature
Gitpod takes an average of 12.9 days to launch a feature
Software development and delivery are a huge part of an organisation's success. One of the key components in the success of the organisation is how fast can they deploy its feature. DORA uses a few key metrics behind all of this to measure and improve performance.
Deployment History
Mean Lead time for changes
Change Failure rate
Time to Restore service
All these metrics measure speed and stability.
Here's a short video to implement DORA metrics by Hezheng (Creator & Maintainer of Apache DevLake)
Overview Dashboard
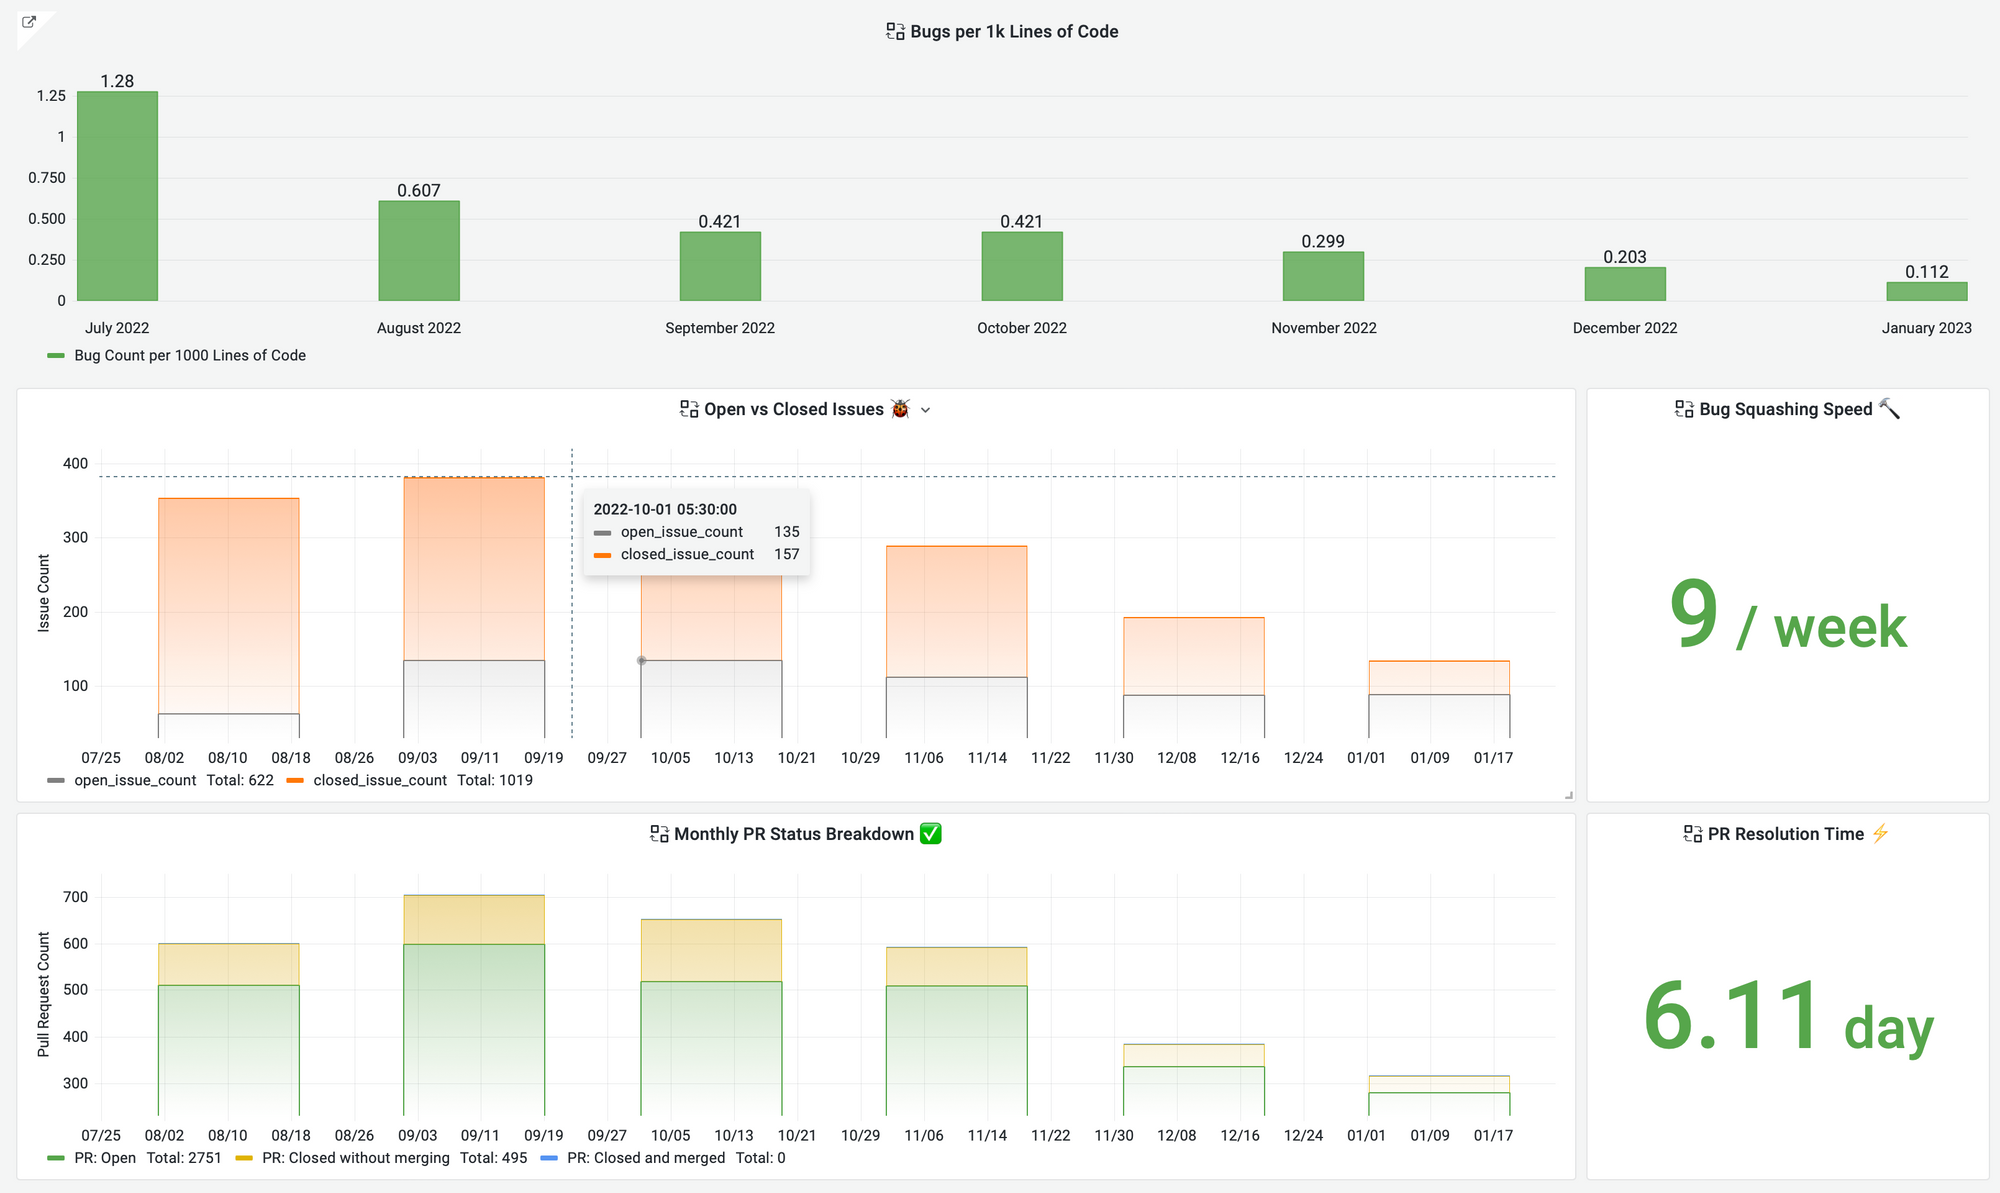
This snapshot is an "Overview Dashboard for Gitpod" created by DevLake
What is Overview Dashboard?
This chart offers a snapshot of the overall layout of the Gitpod, as well as which features should be enhanced and which are the most remarkable. The ability to track workflow among multiple criteria and community standards also give the engineering team and maintainers an advantage.
Bugs per 1K Lines of Code
This information provides the bug density per 1,000 lines of code. The internal QA procedure is enhanced. It determines which practices are efficient or has room for improvement to reduce the number of flaws moving forward.
Bug density for Gitpod decreased from 1.28 in July 2022 to 0.112 in January 2023
Open vs Closed Issues
This solely gives a general idea of the issues, such as how many are currently open to working on and how many are closed.
PR resolution time for Gitpod is 6.11 days
Key Metrics
DevLake engine uses SQL to generate useful metrics to “quantify the quality metrics” of any Project. These are derived from our Domain Layer Schema. Listed below are some interesting metrics for Gitpod.
Bug Squashing Speed ~ 9 bugs resolved per week
PRs merged in 2nd quarter of 2022 ~ 7344 PRs
Bugs per 1000 Lines of Code ~ decreasing curve (from 1 to 0)
12.9 Days for a feature to ship
PR resolution is time is within a week
Conclusion
Successful projects, tools, and organizations are a result of great culture and consistent practices that ensure quality and performance naturally. This "Project spotlight" activity is initiated to recognize the value of Open Source projects.
Join the community to learn more about Gitpod Dashboard. Of course, you may start creating a dashboard for yourself. Try Apache DevLake.